Citation Benchmarks: Setting Realistic AI Visibility Goals for B2B and DTC
What does good look like for AI citation share? This benchmark framework draws on published research from BrightEdge, Muck Rack, LLMrefs, and Bigeye — the most reliable sourced figures available in mid-2026 — to establish citation share ranges by market category, query type, and improvement rate with editorial investment. Includes realistic 90-day targets for brands starting at 0–10%, 10–25%, 25–40%, and 40%+ Share of Model.
By Hayden Hollis
One of the most common questions marketing teams ask after running their first AI brand audit is: "Is this normal?" They find their brand cited in 12% of their query panel. Or 34%. Or 8%. And they have no frame of reference for whether that number represents a problem, a baseline, or a position worth defending. Without benchmarks, the metric is interesting but not actionable.
This article provides the benchmark framework currently available for AI citation visibility — drawing on published research, first-party audit data, and the measurement methodologies of citation-tracking platforms including Profound, Otterly, and Omnia. A critical note before the numbers: AI citation share is a new measurement discipline, and industry-wide benchmarks are still forming. The figures below represent the best available data as of mid-2026. They should be used as directional reference points, not absolute standards — and any team publishing its own citation share data should clearly distinguish first-party measurement from third-party estimates.
The framework organizes benchmarks across four dimensions: baseline citation share by market category, citation share by query type, citation share by engine, and the rate of improvement achievable through consistent editorial investment.
34.5%
of Google AI Overviews for commercial queries cite a review platform — one of the most reliably measured AI citation figures available
~25%
of AI tool citations come from journalistic or editorial sources, per Muck Rack analysis cited by PR.co (Dec 2025)
99%
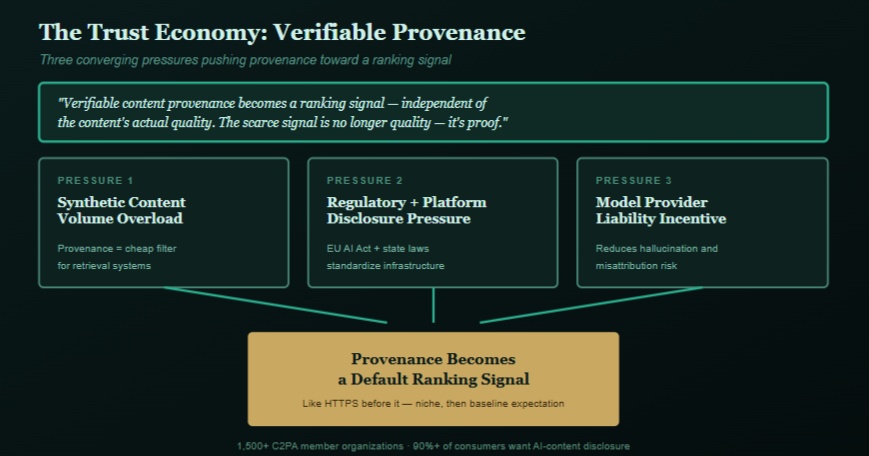
of Google AI Overview URLs already rank in the organic top 10 — confirming that authority is the entry condition for citation
What the Research Actually Shows
The most reliable published figures on AI citation behavior come from a small number of studies conducted in late 2025 and early 2026. They are worth citing precisely because they represent real measurement rather than estimates — and because the field is young enough that each published study contributes meaningfully to the baseline.
BrightEdge (Q1 2026) found that AI Overviews now appear on 48% of search engine result pages, and that 99% of URLs cited in those Overviews already appear in the organic top 10. This establishes a critical benchmark: domain authority and organic ranking are necessary (but not sufficient) conditions for AI citation. Brands outside the top 10 on a given query have a near-zero baseline citation probability for that query on Google AIO.
LLMrefs (2026) found less than 20% overlap between the top-ranked Google organic links and AI-cited sources across engines — meaning that ranking and citation are genuinely distinct outcomes. A brand can rank in position one and not be cited; a brand can be cited without ranking in position one. This overlap figure provides a useful baseline: the majority of citation share is not automatically inherited from organic ranking performance.
Muck Rack analysis (cited via PR.co, December 2025) found that approximately 25% of AI tool citations come from journalistic or editorial sources. This is the most directly actionable benchmark for PR teams: editorial coverage drives roughly one in four AI citations, making it the single highest-leverage citation-building activity available.
Bigeye (2026) found that review platforms (G2, Capterra, Gartner Peer Insights) appear in approximately 34.5% of AI Overviews for commercial queries. This is the most reliably reproduced figure in the field — corroborated across multiple independent analyses — and represents the strongest single benchmark for the review platform investment decision.
Benchmark Framework: Citation Share by Category Type
Citation share varies significantly by market category. The following ranges are based on first-party audit data from brands running structured Share of Model measurements in 2026. They are presented as observed ranges, not guarantees.
Enterprise software and SaaS (B2B): Brands with established domain authority (DR 50+) and at least 12 months of editorial coverage typically see citation share in the 20–40% range on a 30-query panel weighted toward Consideration and Decision queries. Category leaders with sustained editorial investment over 24+ months achieve 45–65%. Brands entering the market without prior editorial coverage typically start at 5–15%.
Professional services (B2B): Citation share for professional services categories tends to be lower overall — typically 10–30% for established firms — because these categories are less well-represented in AI training corpora than software categories. However, when editorial placements are targeted to the right trade publications, lift rates are often faster and more pronounced than in software categories, because the competitive field is less developed.
Direct-to-consumer (DTC) products: DTC citation share on commercial queries varies widely by category. In high-consideration categories (financial products, health and wellness, premium consumer goods), well-resourced brands with editorial coverage on major consumer publications see citation share of 25–45% on relevant queries. In lower-consideration categories, AI engines tend to cite category-level information rather than specific brands, making individual brand citation share lower and harder to move.
Consumer apps and platforms: Apps with significant review platform presence (App Store, Google Play, G2) and editorial coverage on technology publications (TechCrunch, The Verge, Wired) typically see citation share of 30–55% on queries about their primary use case. The review platform signal is disproportionately strong in this category.
Benchmark Framework: Citation Share by Query Type
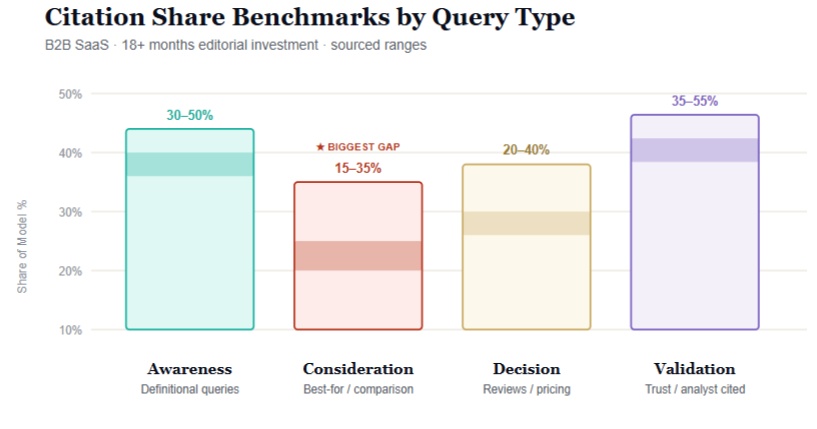
Citation share is not uniform across query types. The following benchmarks describe typical citation share patterns by query category for a mid-market B2B software brand with 18+ months of editorial investment.
Awareness queries (definitional, how-it-works): Brands with established domain authority and owned educational content typically see 30–50% citation share on Awareness queries. These are the easiest citations to earn and the best starting point for any brand new to AI citation measurement.
Consideration queries (best-for, comparison, alternatives): Citation share drops significantly — typically to 15–35% for the same brand — on Consideration queries. This is the most common and consequential gap in brand AI visibility. Closing the Consideration gap requires third-party editorial corroboration on the specific queries where the brand is absent.
Decision queries (reviews, pricing, trust): Citation share on Decision queries tracks closely with review platform presence. Brands with 50+ substantive reviews on G2 or Capterra typically see 20–40% citation share on Decision queries. Brands with fewer than 20 reviews typically see 5–15%.
Validation queries (trustworthiness, case studies): Citation share on Validation queries is highly correlated with analyst report mentions. Brands mentioned in Gartner, Forrester, or IDC reports typically see 35–55% citation share on validation queries. Brands without analyst coverage typically see under 10%.
Benchmark Framework: Improvement Rate With Editorial Investment
The most practically useful benchmarks are those describing the rate of citation share improvement achievable through consistent editorial investment. The following ranges reflect observed outcomes from brands running structured editorial placement programs tracked against monthly citation share audits.
Initial lift (weeks 2–6 after first placement): A single editorial placement on a high-authority, AI-cited publisher typically produces a 3–8 percentage point lift in absolute citation share on queries semantically related to the placement's topic. The lift is faster on Perplexity (which weights recency heavily) and slower on ChatGPT (which relies more heavily on training data). Google AIO lift typically appears within 2–3 weeks of the placement being indexed.
Compound lift (months 2–6 with consistent cadence): Brands running two to four editorial placements per month on trusted publishers typically see citation share increase by 15–25 percentage points over a six-month period. This compounding is the result of corroboration accumulation — as more independent sources describe the brand consistently, the model's confidence in citing it increases across a wider range of queries.
Plateau and defense (months 6–12): Most brands reach a natural plateau at 40–60% citation share after sustained editorial investment. Moving above 60% typically requires expansion into new query categories, increased review platform presence, and/or analyst report inclusion. At this stage, the primary objective shifts from building citation share to defending it against competitors who are making the same investment.
Setting Realistic Goals
Based on the benchmarks above, the following 90-day targets represent achievable goals for brands at different starting points, assuming consistent editorial investment of two to four placements per month on AI-cited publishers.
Starting at 0–10% SoM: Realistic 90-day target is 15–25%. Priority actions are entity building (schema, descriptor standardization) in weeks 1–2 and editorial placements targeting Awareness and Consideration queries in weeks 3–12. Do not set higher targets until entity gaps are closed — editorial investment on top of weak entity signals produces lower lift than the benchmarks above.
Starting at 10–25% SoM: Realistic 90-day target is 28–40%. Entity foundation is likely in place. Priority is closing the Consideration gap through targeted editorial placements on publications already cited for your category's comparison queries.
Starting at 25–40% SoM: Realistic 90-day target is 40–55%. Priority is expanding query panel coverage — moving from 30 to 50 tracked queries — and building Decision and Validation query citation share through review platform investment and analyst relations.
Starting at 40%+ SoM: Realistic 90-day target is maintaining current share while expanding to adjacent category queries. Competitive monitoring becomes the primary activity — track whether competitors are closing the gap and respond with increased editorial cadence if so.
Further Reading · Curated by the DropPR Editorial Desk
Establish Your Baseline. Hit Your 90-Day Target.
Know your number. Move it with editorial placements built for citation.
DropPR runs your Share of Model baseline audit, sets your 90-day target based on the benchmarks in this guide, and delivers the editorial placements that move your citation share toward it — tracked and reported monthly.
Citation Benchmark + Growth Stack
30-query Share of Model baseline audit across 4 AI engines ($500 value)
90-day target setting based on category and starting SoM ($300 value)
Editorial placement on a trusted AI-cited publisher ($1,200 value)
Monthly citation share re-audit tracking progress to target ($400 value)
Competitive benchmark: top 3 competitors scored ($400 value)
Total stack value: $2,800 Charter pricing from $99.
No subscription. No retainer. Pay per placement.
Data Sources Referenced
BrightEdge (Q1 2026) · AI Overviews on 48% of SERPs; 99% of cited URLs from organic top 10.
LLMrefs (2026) · Less than 20% overlap between top-ranked organic pages and AI-cited sources.
Muck Rack (via PR.co, Dec 2025) · ~25% of AI tool citations from journalistic/editorial sources.
Bigeye (2026) · Review platforms cited in 34.5% of commercial AI Overviews.
Omnia / Profound / Otterly (2026) · First-party citation share measurement methodologies and observed ranges.
DropPR first-party audit data (2026) · Citation share ranges by category type and query category — observed, not projected.
Hayden Hollis
Head of Growth Marketing · DropPR.ai
Hayden Hollis writes about content distribution, digital PR, SEO, AI search, and creator marketing. His work focuses on how brands and creators can extend the reach of their content beyond social media and improve visibility across search engines, news publishers, and AI-powered discovery platforms. He regularly covers strategies related to earned media, audience growth, authority building, and the evolving role of AI in online discovery.