Understanding Share of Model: A New Metric for AI Citation Visibility
Share of Voice measured what you competed for in broadcast media. Share of Model measures what you compete for in AI search — the percentage of buyer queries in which your brand is named in synthesized answers. A full definition, the exact formula, a six-step calculation method, benchmark ranges by citation maturity (0–15%, 15–35%, 35–55%, 55%+), and a CFO-ready reporting framework for the metric that replaces impressions in the AI era.
By Hayden Hollis
Every marketing discipline that has ever mattered has eventually produced a metric that named the thing it was trying to measure. Share of voice named the thing TV advertising was competing for. Domain authority named the thing SEO was building. Click-through rate named the thing email marketing was optimizing. In each case, the naming of the metric preceded the discipline's maturation — because you cannot systematically improve what you have not precisely defined.
AI citation visibility is now at that inflection point. The thing being competed for is real and measurable. Brands are appearing in AI-synthesized answers, or they are not. Their competitors are being named, or they are not. The shortlist being assembled inside ChatGPT, Perplexity, and Google AI Mode for a buyer's category query includes some brands and excludes others — and that inclusion or exclusion is now the most consequential marketing outcome in B2B. But most marketing teams are still measuring it with proxies: organic traffic, keyword rankings, impressions. These are not the thing. They are shadows of the thing.
Share of Model is the metric that names the thing directly. This article defines it, provides the formula, explains how to calculate it, and makes the case for why it should replace share of voice as the primary brand visibility KPI for any company whose buyers use AI engines during vendor evaluation — which, in 2026, is virtually every company selling anything above a transactional price point.
48%
of Google SERPs now feature an AI Overview — the surface Share of Model is designed to measure
1B+
weekly ChatGPT queries — the corpus from which Share of Model citation events are drawn
3–5
brands typically named per AI answer for a commercial category query — the competitive set Share of Model tracks
Defining Share of Model
Share of Model (SoM) is the percentage of AI-engine responses to a defined panel of buyer queries in which a brand is named as a relevant source, vendor, tool, or authority. It is calculated as follows:
Share of Model Formula:
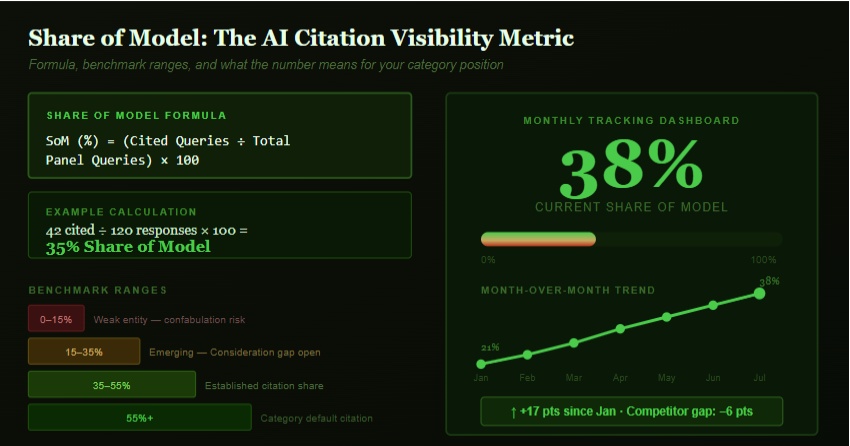
Share of Model (%) = (Queries where Brand is Named ÷ Total Queries in Panel) × 100
For example: if a brand runs a 30-query audit panel across ChatGPT, Perplexity, Google AI Mode, and Claude (120 total query-engine combinations), and the brand is named in 42 of those 120 responses, its Share of Model is 35%.
The metric has three configurable parameters that determine its precision and interpretive value. The query panel defines the scope — which queries are included and how they are categorized. The engine set defines the surface — which AI engines are included in the measurement. The competitive normalization defines the relative position — whether Share of Model is reported as an absolute percentage or as a share relative to competitors named in the same query responses.
Why Share of Model Is Not Share of Voice
Share of voice (SoV) is a legacy brand metric that measures the proportion of total category advertising or media impressions attributable to a brand. It was designed for broadcast media environments where attention was purchased and impressions were the unit of competition. It has been adapted, imperfectly, to digital marketing environments where it typically measures keyword visibility or earned media mentions relative to competitors.
Share of Model differs from share of voice in four structural ways that make it a more accurate measure of AI-era brand visibility.
SoM measures synthesized inclusion, not raw mention volume. Share of voice counts mentions — how many times a brand appears in media or search results. Share of Model counts inclusions in synthesized answers — a categorically different outcome. Being mentioned in a press release that gets indexed is a share of voice event. Being named in the answer a buyer reads when they ask ChatGPT "what are the best tools for X" is a Share of Model event. The latter is the event that influences shortlist construction. The former may not be.
SoM is query-specific, not impression-weighted. Share of voice aggregates impressions across all contexts, weighting by reach. Share of Model is measured against specific buyer queries — the exact questions your highest-intent customers are asking AI engines. A brand with high share of voice but low Share of Model on its most critical buyer queries is winning media presence but losing the consideration moment.
SoM is directly actionable. A share of voice decline tells you that competitors are spending more on media or generating more coverage. It does not tell you which queries you are losing on or which AI engines are excluding you. A Share of Model decline tells you exactly which query categories your citation is slipping in and which engines are most responsible — enabling precise editorial and structural interventions.
SoM is the leading indicator, not the lagging one. Organic traffic and rankings measure the downstream effect of AI visibility — the branded search that follows a zero-click AI encounter. Share of Model measures the AI encounter itself. In a zero-click world, traffic is increasingly a lagging indicator of visibility events that happened before anyone clicked. Share of Model is the early signal those traffic patterns are generated by.
How to Calculate Share of Model: A Step-by-Step Method
Step 1 — Define your query panel. Select 25–50 queries that represent the full range of questions your ideal buyer asks during vendor evaluation. Organize them into four categories: Awareness queries (definitional, how-it-works), Consideration queries (best-for, comparison), Decision queries (pricing, reviews, alternatives), and Validation queries (trustworthiness, case studies). Weight the panel toward Consideration and Decision queries — those are the shortlist-construction moments where Share of Model is most consequential.
Step 2 — Define your engine set. Select four AI engines for your measurement panel: ChatGPT, Perplexity, Google AI Overviews, and either Claude or Gemini. Run each query on each engine. Total response count = (number of queries) × (number of engines). A 30-query, 4-engine panel produces 120 measurable responses.
Step 3 — Score each response. For each query-engine combination, record a binary score: 1 if your brand is named in the response, 0 if it is not. Also record which competitors are named. The competitor data builds your relative Share of Model — what percentage of responses that named any brand in your category named your brand specifically.
Step 4 — Calculate absolute and relative SoM. Absolute SoM = (total 1s ÷ total responses) × 100. Relative SoM = (responses naming your brand ÷ responses naming any brand in your category) × 100. Track both. Absolute SoM tells you your overall AI visibility. Relative SoM tells you your position within the competitive set — whether you are gaining or losing ground relative to named competitors.
Step 5 — Segment by query category. Calculate SoM separately for Awareness, Consideration, Decision, and Validation query categories. Most brands have high Awareness SoM (they appear in definitional answers about their category) and low Consideration SoM (they are absent from "best X for Y" answers). The category-level breakdown tells you where to concentrate editorial investment.
Step 6 — Establish baseline and track monthly. Your first measurement is your baseline. Run the same panel on the same engines monthly. Track absolute SoM, relative SoM, and category-level SoM over time. Correlate SoM changes with editorial placement dates to measure the citation lift each placement produces. The 30-day lag between placement and measurable SoM lift is typical; expect to see the full effect of a placement in the second monthly measurement after it runs.
What Share of Model Benchmarks Look Like
Based on analysis of B2B SaaS, professional services, and technology brands running structured Share of Model audits in 2026, the following benchmarks provide a useful reference frame.
0–15% SoM: The brand is a weak entity in the AI knowledge graph. It appears occasionally in Awareness queries but is largely absent from Consideration and Decision queries. The brand's competitors are being named on queries where the brand should appear. Primary intervention: entity building (schema, descriptor standardization, third-party corroboration) before content investment.
15–35% SoM: The brand is a recognized entity with emerging citation patterns. It appears consistently in some query categories but inconsistently in others. Consideration query SoM is typically 10–20 percentage points below Awareness SoM. Primary intervention: targeted editorial placements closing specific Consideration and Decision query gaps.
35–55% SoM: The brand has established citation share across most query categories. It is named in a majority of relevant AI responses. Consideration SoM is within 10 points of Awareness SoM. Primary intervention: competitive monitoring and cadence maintenance to defend and extend share.
55%+ SoM: The brand is the default citation for its category across most AI engines. It appears in more than half of all relevant AI responses and is typically named first or second. Primary intervention: expanding the query panel to adjacent categories and defending share against emerging competitors investing in editorial corroboration.
Reporting Share of Model to Leadership
Share of Model should be reported to marketing leadership and the C-suite on a monthly cadence alongside the three supporting metrics that contextualize it: branded search volume (the downstream signal that corroborates SoM changes), editorial placement count (the primary input that drives SoM), and competitive SoM delta (how your SoM changed relative to your top two competitors).
The single-number monthly report looks like this: "Our Share of Model this month was 38% across our 30-query panel, up from 31% last month. The lift correlates with our Forbes placement on May 12 and our TechCrunch mention on May 19. Our closest competitor's SoM is estimated at 44%, concentrated in Consideration queries where our gap remains largest. Our next editorial placement targets that category directly."
This is the kind of report that CFOs recognize as a real measurement framework — not an impression count, not an AVE, not a ranking report, but a direct measurement of the competitive ground your brand holds inside the surfaces your buyers are using to build their shortlists. Share of Model is the metric that makes AI visibility legible to finance. And that legibility is what protects and grows the editorial budget that drives it.
Further Reading · Curated by the DropPR Editorial Desk
Measure Your Share of Model — Then Build It
Know your baseline. Track your lift. Report the metric that actually measures what matters.
DropPR runs your Share of Model baseline audit across 30 buyer queries and four AI engines, delivers editorial placements that move the number, and provides monthly reporting that ties each placement to measurable citation share lift. The metric and the mechanism — in one stack.
Share of Model Measurement + Growth Stack
30-query SoM baseline audit across ChatGPT, Perplexity, AIO, Claude ($500 value)
Competitive SoM benchmark (top 3 competitors scored) ($400 value)
Editorial placement closing highest-gap query category ($1,200 value)
30-day re-audit measuring SoM lift post-placement ($400 value)
Monthly SoM dashboard — CFO-ready one-page report ($300 value)
Total stack value: $2,800 Charter pricing from $99.
No subscription. No retainer. Pay per placement.
Data Sources Referenced
BrightEdge · AI Overviews on 48% of SERPs as of Q1 2026.
OpenAI disclosures (2026) · ChatGPT processing over 1 billion queries per week.
Omnia (2026) · Citation analysis methodology; Share of Model calculation framework.
LLMrefs (2026) · Generative engine optimization; citation share as primary AI visibility metric.
Bigeye (2026) · AEO complete guide; 3–5 brands named per AI commercial query response.
DropPR analysis (2026) · Share of Model benchmark ranges by citation maturity level.
Hayden Hollis
Head of Growth Marketing · DropPR.ai
Hayden Hollis writes about content distribution, digital PR, SEO, AI search, and creator marketing. His work focuses on how brands and creators can extend the reach of their content beyond social media and improve visibility across search engines, news publishers, and AI-powered discovery platforms. He regularly covers strategies related to earned media, audience growth, authority building, and the evolving role of AI in online discovery.